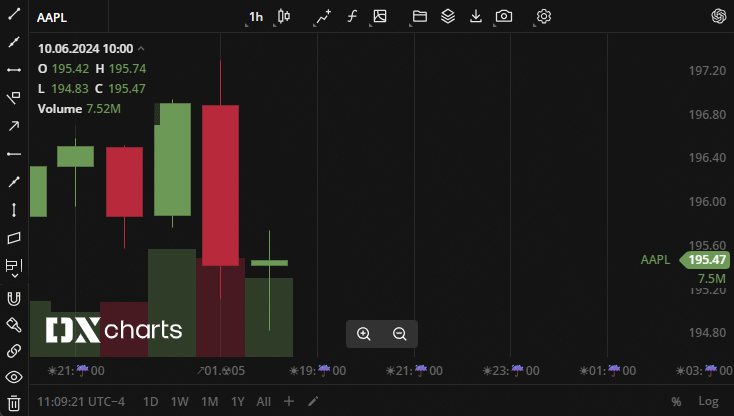
X-axis
The X-axis is generated automatically based on the label configuration and candle data.
Key configuration options include:
- Label configuration (time format)
- Appearance (font, padding)
For full details, see X-axis component API
Label types and generation
DXcharts supports multiple label types, such as:
year,month,day,weekdayhour,minute,second,lessThenSecondweek-weekday
Higher-level labels take precedence (e.g., year > month).
If both apply to the same candle, only the higher-level label is shown.
There are also auxiliary labels with coarser granularity:
minute: includes5min,15min,30minhour: includes4h,12hmonths: includes3M(quarter-year),6M(half-year)
Label types are selected based on the aggregation period. Labels are spaced evenly across the axis when possible.
X time labels are generated based on selected aggregation period and follow these rules:
| Name | Condition | Default format | Example |
|---|---|---|---|
| year | period >= 1 day | YYYY | 2020 |
| month | period >= 1 day | MMM | Jul |
| weekday | any period, only for last week candles | EEE | Wed |
| day | any period, except for last week candles | dd.MM | 08.07 |
| hour | period < 1 day | HH:mm | 10:00 |
| minute | period < 1 day | HH:mm | 10:02 |
• week-weekday label
This label type marks specific days of the week within a month, based on the number of the week and the weekday.
It uses a postfix format like week-weekday_3_5, where:
- The first number indicates the week number in the month (1–6 or
$for the last week). - The second number indicates the day of the week (1–7).
For example, week-weekday_3_5 shows a label on every third Friday of the month.
Appearance and layout
Font and padding
You can customize the font of X-axis labels using:
export const changeFont = () => {const config = getDefaultConfig();config.components.xAxis.fontSize = 10;config.components.xAxis.fontFamily = 'Open Sans, sans-serif';}
You can also configure extra vertical space (padding) above and below labels using:
export const changePaddings = () => {const config = getDefaultConfig();config.components.xAxis.padding.top = 8;config.components.xAxis.padding.bottom = 16;}
Label length and spacing
The X-axis label generator (x-labels-generator) spaces labels based on the maximum possible length of any label format.
For example, HH:mm:ss is 8 characters long.
Even if only shorter formats are used, spacing is still calculated using the longest. This can lead to uneven distribution.
To improve spacing, remove long formats you don't need.
For instance, if seconds are not relevant, remove HH:mm:ss to reduce the expected length and improve alignment.
export const chartConfigExample = {components: {xAxis: {formatsForLabelsConfig: {minute_1: 'HH:mm',minute_5: 'HH:mm',minute_30: 'HH:mm',hour_1: 'HH:mm',day_1: 'dd.MM',month_1: 'MMM',year_1: 'YYYY',},},},}
The example above limits formats to an average of 5 characters, allowing the chart to distribute labels more evenly.
export const initialChartConfig = {components: {xAxis: {formatsForLabelsConfig: {lessThanSecond: 'mm:ss',second_1: 'HH:mm:ss',minute_1: 'HH:mm',minute_5: 'HH:mm',minute_30: 'HH:mm',hour_1: 'HH:mm',day_1: 'dd.MM',month_1: 'MMM',year_1: 'YYYY',},},},}
Regional date format
You can change the date format for X-axis labels using a configuration object like this:
export const config: Partial<Record<TimeFormatWithDuration, string>> = {lessThanSecond: 'mm:ss',minute_1: 'HH:mm',hour_1: 'HH:mm',day_1: 'dd.MM',month_1: 'MMM',year_1: 'YYYY',}
export const exampleN4 = {day_4: 'MM.dd',}
Each label type (except lessThenSecond) includes a numeric postfix that defines when the label should appear and how it should be formatted.
Valid postfix ranges:
second,minute: 1–60hour: 1–24day: 1–31month: 1–12year: >=1
Custom label formatting
If you need full control over how time is formatted, you can override the default DateTimeFormatter.
Note: this affects the entire dxcharts-lite library, not just the X-axis.
export const customFormatterConfigExample = {dateFormatter: {// formatter works with pattern string like "HH.mm.ss" => "12:46:33"createFormatterFunction: (pattern: string) => (dateTimestamp: number) => {const date = new Date(dateTimestamp);const hour = date.getHours();const minute = date.getMinutes();const seconds = date.getSeconds();const day = date.getDay();const month = date.getMonth();const year = date.getFullYear();const formattedDate = pattern.replace('yyyy', `${year}`).replace('MM', month < 10 ? `☢0${month}` : `☢${month}`).replace('dd', day < 10 ? `↗0${day}` : `↗${day}`).replace('HH', hour < 10 ? `☀0${hour}` : `☀${hour}`).replace('mm', minute < 10 ? `☔0${minute}` : `☔${minute}`).replace('s', seconds < 10 ? `☘0${seconds}` : `☘${seconds}`);return formattedDate;},},}
After setting your own formatter, you'll see the new custom labels applied:

Configuration examples
Use configuration or API to apply custom formatting:
export const setFormatsForLabelsConfig = (chart: ChartBootstrap, config: Record<TimeFormatWithDuration, string>) => {// using APIchart.xAxis.setFormatsForLabelsConfig(config);}
Example day_1
The following configuration creates labels using the day label type.
For each candle whose date is divisible by 1 (i.e., every day), a label will appear with the specified formatting.
export const exampleN1 = {day_1: 'dd',}
This configuration produces the following X-axis label layout:

Example day_3
In this case, a label is created for each candle whose date is divisible by 3.
export const exampleN2 = {day_3: 'dd',}
This configuration produces the following layout:

Example day_5!
This configuration highlights a specific candle by adding ! after the number.
For example, day_5! marks a specific date even if it's not divisible by 5.
export const exampleN3 = {day_3: 'dd','day_5!': 'dd',}
This produces:

You can combine multiple rules for the same label type. If rules overlap, the one with the larger number in the postfix takes precedence.
These rules apply to all label types the same way.